Getting started
The focus of this micro-tutorial is how to render echarts components in a React application so for tutorial purposes let's start by creating a React application using create-react-app.
create-react-app echarts
cd echarts
Now we have our basic react project ready, it's time to add echarts dependency by running.
npm i echarts
Note: Adding is needed --save just in case you have npm lower than 5.0.0.
I like to watch every small change I do in my browser so I'll start my server.
npm start
Get to work
Let's create a new component called Chart.js, for the tutorial I'll place it in src.
import React from "react"
import echarts from "echarts"
export default function Chart() {
  return (
    <div
      style={{
        width: "100%",
        height: "100%",
      }}
    ></div>
  )
}
As echarts uses DOM element to create it's instance we'll use useRef hook to provide the component access to this element.
import React, { useRef } from "react"
export default function Chart() {
  const myChart = useRef(null)

  return (
    <div
      ref={myChart}
      style={{
        width: "100%",
        height: "100%",
      }}
    ></div>
  )
}
Now we have our reference to DOM element so we can give echarts our Reference, but we need to use useEffect hook so we don't execute it in every render.
import React, { useRef, useEffect } from "react"
import echarts from "echarts"

export default function Chart() {
  const myChart = useRef(null)
  useEffect(() => {
    const chart = echarts.init(myChart.current)
  }, [])

  return (
    <div
      ref={myChart}
      style={{
        width: "100%",
        height: "100%",
      }}
    ></div>
  )
}
At this point we have an instance of echarts running on our application, but as you should know echarts works with options that defines the charts.
I'll put this options as property so we can create multiple charts based on this component.
import React, { useRef, useEffect } from "react"
import PropTypes from "prop-types"
import echarts from "echarts"

function Chart({ options }) {
  const myChart = useRef(null)
  useEffect(() => {
    const chart = echarts.init(myChart.current)
    chart.setOption(options)
  }, [options, resizeObserver])

  return (
    <div
      ref={myChart}
      style={{
        width: "100%",
        height: "100%",
      }}
    ></div>
  )
}

Chart.propTypes = {
  options: PropTypes.any,
}

export default Chart
Well now we can call our component like this.
import Chart from "./Chart.js"
const MyComponent = () => (
  <div>
    <Chart options={ChartOptions} />
  </div>
)
Let' create a folder called charts and two files inside:
line.js
export default {
  xAxis: {
    type: "category",
    data: ["Mon", "Tue", "Wed", "Thu", "Fri", "Sat", "Sun"],
  },
  yAxis: {
    type: "value",
  },
  series: [
    {
      data: [820, 932, 901, 934, 1290, 1330, 1320],
      type: "line",
      smooth: true,
    },
  ],
}
bars.js
export default {
  xAxis: {
    type: "category",
    data: ["Mon", "Tue", "Wed", "Thu", "Fri", "Sat", "Sun"],
  },
  yAxis: {
    type: "value",
  },
  series: [
    {
      data: [120, 200, 150, 80, 70, 110, 130],
      type: "bar",
      showBackground: true,
      backgroundStyle: {
        color: "rgba(220, 220, 220, 0.8)",
      },
    },
  ],
}
Have done this, we import our whole new Chart Component, which is ready to get some chart rendered.
import React from "react"
import Chart from "./Chart"
import line from "./charts/line"
import bars from "./charts/bars"
import "./App.css"

function App() {
  return (
    <div className="App">
      <Chart options={line} />
      <Chart options={bars} />
    </div>
  )
}

export default App
At this point you should have something like this
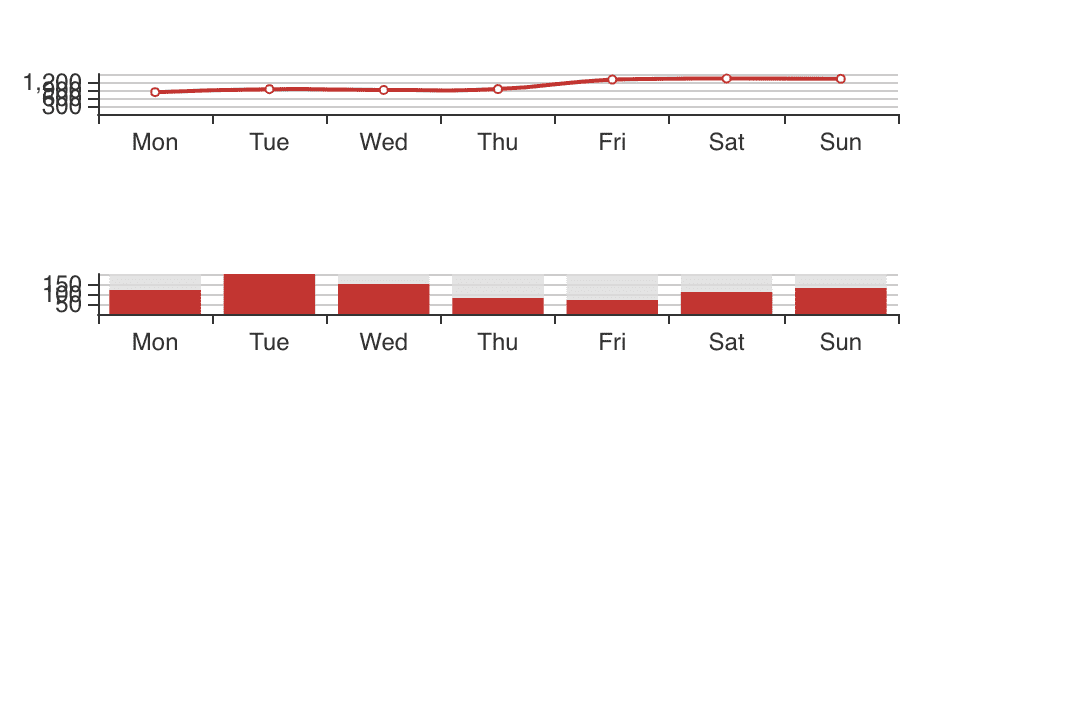
I doesn't looks amazing, but we have initialized echarts in our react component, and now we can style the wrapper to make them fit as we want.
import React from "react"
import Chart from "./Chart"
import line from "./charts/line"
import bars from "./charts/bars"
import "./App.css"

function App() {
  return (
    <>
      <h1>Echarts in React without libraries</h1>
      <div className="App" style={{ display: "flex", flexDirection: "row" }}>
        <div style={{ width: "50%", height: 300 }}>
          <Chart options={line} />
        </div>
        <div style={{ width: "50%", height: 300 }}>
          <Chart options={bars} />
        </div>
      </div>
    </>
  )
}

export default App
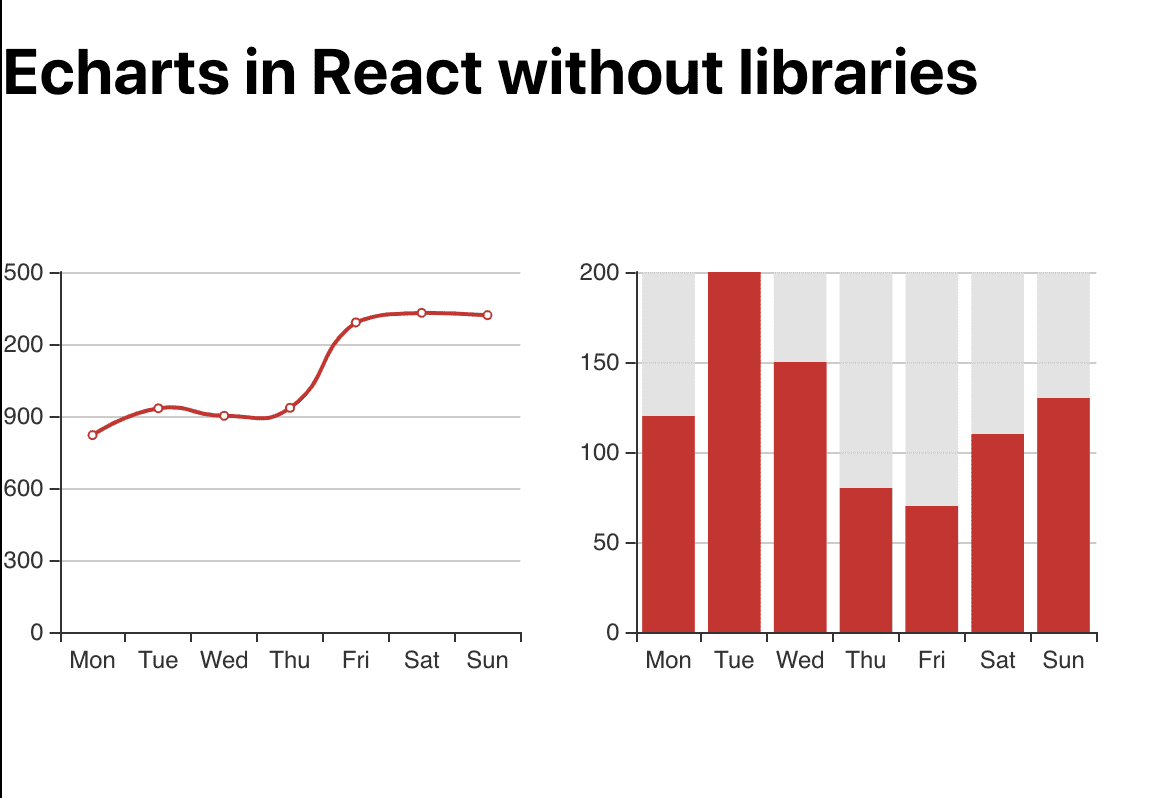
There you go! Now it looks much better!
In the next tutorial we'll learn how to make this charts to respond to resizing 🚀