Getting started
If you don't know how to render a echarts component inside React, please check Using echarts with react without libraries, first.
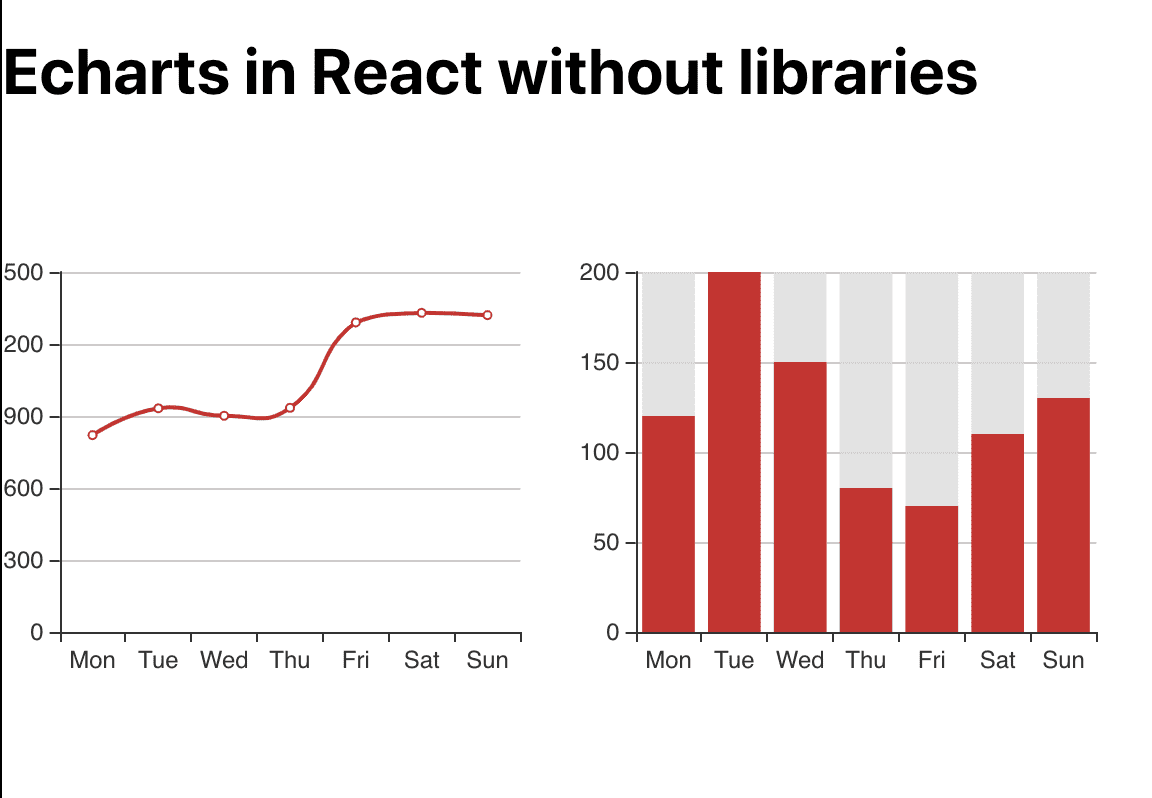
We should have something like this
But, what happens when window is resized and my wrappers shrinks or grows? 😮
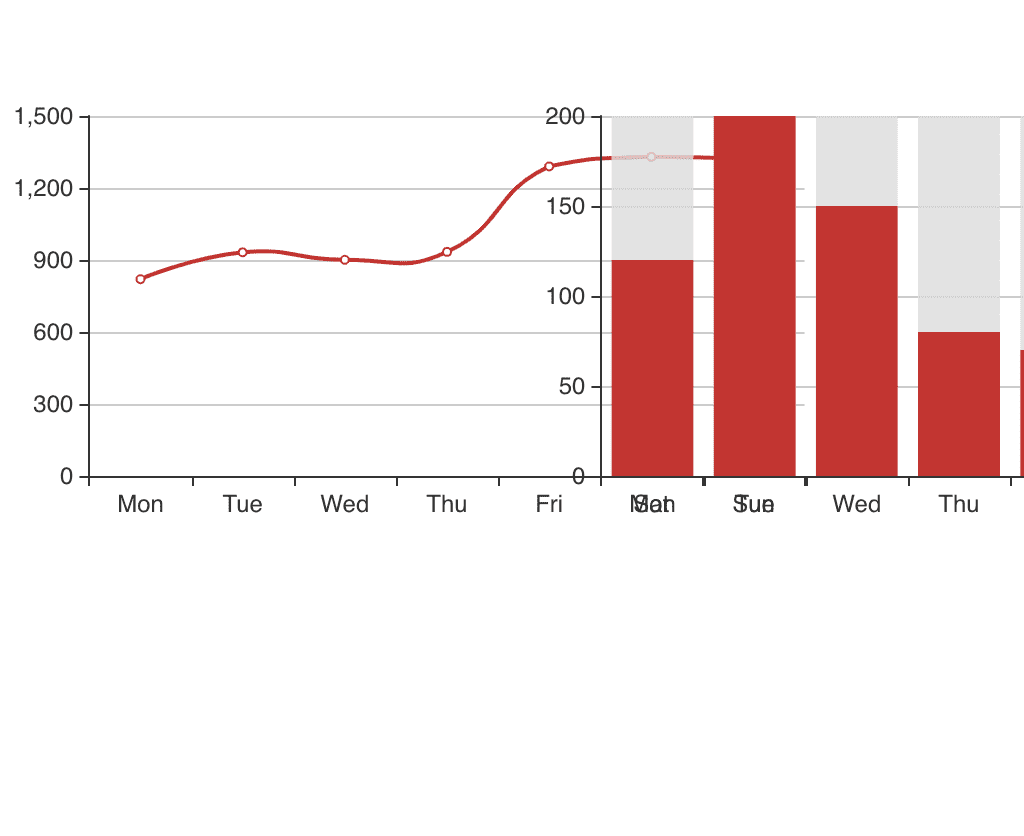
Tada!🎉, the chart stays the same even when the wrapper shrinks, that's not good.
So let's fix this behaviour
I found 2 ways to do it, probably there are more, but I'll explain only this 2
-
- Using Resize Observer API a solution for modern browsers.
-
- Using
window.onrizeevent.
- Using
As I normally work for modern browsers my favorite is the first and is shorter too...
Using Resize Observer API
I'll create a new file for the observer at utils/resizeObserver.js
import echarts from "echarts"
export default new ResizeObserver(entries => {
  entries.map(({ target }) => {
    const instance = echarts.getInstanceByDom(target)
    if (instance) {
      instance.resize()
    }
  })
})
This file will return a ResizeObserver that will catch all resize events of the DOM Element registered to be observed by it.
Inside the observer we receive the entries argument which are the list of observed DOM Elements that are being resized.
Also I'm using echarts.getInstanceByDom to use the target element to get the current echart instance and resize the chart corresponding to the resized element.
Let's import react observer in our App Component and send it as property to our charts, so we use same observer for both.
import React from "react"
import Chart from "./Chart"
import line from "./charts/line"
import bars from "./charts/bars"
import resizeObserver from "./utils/resizeObserver"
import "./App.css"
function App() {
  return (
    <>
      <h1>Echarts in React without libraries</h1>
      <div className="App" style={{ display: "flex", flexDirection: "row" }}>
        <div style={{ width: "50%", height: 300 }}>
          <Chart options={line} resizeObserver={resizeObserver} />
        </div>
        <div style={{ width: "50%", height: 300 }}>
          <Chart options={bars} resizeObserver={resizeObserver} />
        </div>
      </div>
    </>
  )
}

export default App
Then there's only one more thing to do, register our DOM Elements to the Resize Observer.
import React, { useRef, useEffect } from "react";
import PropTypes from "prop-types";
import echarts from "echarts";

function Chart({ options, resizeObserver }) {
 ....
  useEffect(() => {
    const chart = echarts.init(myChart.current);
    chart.setOption(options);
    if (resizeObserver) resizeObserver.observe(myChart.current);
  }, [options, resizeObserver]);
....

Chart.propTypes = {
  options: PropTypes.any,
  resizeObserver: PropTypes.oneOfType([PropTypes.func, PropTypes.object]),
};

export default Chart;
We only need to add the property resizeObserver and then use it to register the DOM Element inside UseEffect Hook.
And now we have resizable charts 😉